You are here: CLASSE Wiki>CBETA Web>CBETA-Beam-Commisioning>CBV (24 Oct 2018, AdamBartnik)Edit Attach
CBV (CBETA Viewer)
CBV is the primary way of viewing both real and virtual machine BPM data, and other optics functions from the virtual machine. It is still in heavy development, so this wiki will be documenting its state as of October 2018.Starting CBV
- The matlab script itself is located in /nfs/erl/online/ops/matlab_scripts/cbv/cbv.m
- It can also be run from the console as erpopr by typing "cbv"
Using CBV
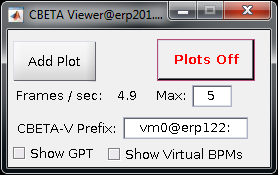
After running the program, the (small) main window will appear. Make sure that the virtual machine prefix is set correctly, and press "Add Plot" to begin.
- Add Plot : Press this to open a new plot window
- Plots On/Off : Click this to change whether all plot windows are updating or not
- Frames / sec, and Max : Shows the current rate that plots are updated, and the target value (called "Max"). Changes to the target value require toggling plots on and off.
- CBETA-V Prefix : Which virtual machine to display data from (in addition to the real machine data)
- Show GPT : Whether to also show data from the GPT simulation
- Show Virtual BPMs : Whether to display virtual BPM data instead of real BPM data
 Points are at BPM locations (either real or virtual) and the line is made by CBETA-V.
Left side controls
 - Plot type selection : Choose what to display, e.g. "Orbit: X", "Dispersion", "Energy", etc.
- Subtract reference : Whether to subtract off the design values. Useful to see differences in orbit positions. Default = On
- Plot Ranges and Units : Here the range and units for the x and y axis can be chosen. Clicking "Auto" will show all the data, and choose the appropriate units.
- Set range by section name : Here you can choose which section of the machine to start and end the plot, e.g. plot from "S1" through "FA".
- Use BMAD Colors : Change the default colors of the layout pictures to those in BMAD
- Top plot : Here is the plot chosen by the plot type selection.
-
 : The user can interact with the top plot like a normal Matlab plot, but when zooming or clicking on data, the plot will not update until the zoom or data selection tool is de-selected.
-
- Bottom layout plot : On the bottom plot is a cartoon description of the layout with different shapes and colors for different types of optics. Only the optics that the operator can control are shown (so, no FFA magnets). The range of this plot is fixed to be the same as the top plot.
Edit | Attach | Print version | History: r1 | Backlinks | View wiki text | Edit wiki text | More topic actions
Topic revision: r1 - 24 Oct 2018, AdamBartnik
- Webs
-
 ACC
ACC
-
 ACL
ACL
-
 Bunch
Bunch
-
 CBB
CBB
-
 NSF
NSF
-
 CBETA
CBETA
-
 CESR
CESR
-
 Private
-
 CHESS
CHESS
-
 FMB
FMB
-
 Maia
Maia
-
 XIMG
XIMG
-
 XLEAP
XLEAP
-
 CHEXS
CHEXS
-
 CLASSE
-
 Inventory
-
 CLEO
CLEO
-
 CMSPhase2MREFC
-
 Computing
-
 Blogs
Blogs
-
 Newsletter
-
 Cosmology
-
 DarkPhoton
-
 ERL
ERL
-
 EngineeringDesignDrafting
-
 G2
G2
-
 HEP
HEP
-
 DBSWorkshop
-
 SWIG
SWIG
-
 HLLHCCMSMREFC
-
 HMF
HMF
-
 HumanResources
-
 Private
-
 ILC
ILC
-
 Americas
-
 CesrTA
-
 Proposal
-
 DampingRings
-
 AreaLeaders
-
 CTA09
CTA09
-
 ILCDR06
-
 ILCDR07_KEK
-
 ILCDR08
-
 S3TaskForce
-
 WWS
WWS
-
 MacCHESS
-
 Main
Main
-
 People
-
 PhotocathodeBrightBeams
-
 REU
REU
-
 SRF
SRF
-
 Safety
-
 Sandbox
-
 TestWeb
-
 System
-
 Theory
-
 Communications
-
 Documents
-
 Phase2MREFC
-
 WebDev
-
 XLEAP
XLEAP
 Copyright © by the contributing authors. All material on this collaboration platform is the property of the contributing authors.
 Ideas, requests, problems regarding CLASSE Wiki? Send feedback
